Setting Up Prometheus with NGINX Proxy & Authentication + Configuring Agent Pools
Search for a command to run...
No comments yet. Be the first to comment.
Challenge: Part 2 Continuous Deployment and Load Testing Deploy the provided application to your chosen cloud provider using any service that runs the application as a Docker container. Then, create a test plan for the application's home page and gen...
Recentemente, ao ler o livro "Manual de DevOps", me deparei com um capítulo dedicado à telemetria em DevOps que expandiu significativamente minha compreensão sobre o tema. O autor apresenta a telemetria como um pilar fundamental da computação moderna...

Introdução Nos dois últimos artigos publicados, exploramos a auto-instrumentação e a instrumentação utilizando o OpenTelemetry Operator no Kubernetes. Agora, vamos abordar um caso de teste prático usando a instrumentação manual do OpenTelemetry. A p...

Introdução: Anteriormente, realizamos a instrumentação manual da nossa aplicação. Neste artigo, vamos explorar a auto-instrumentação utilizando o OpenTelemetry Operator, uma funcionalidade que simplifica significativamente o processo de instrumentaçã...
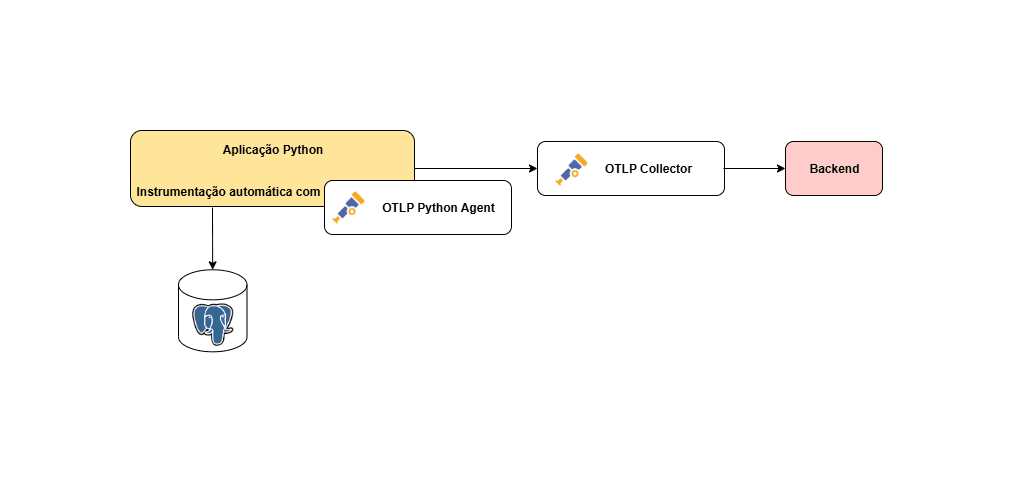
Introdução: Vamos começar fazendo a instrumentação de uma aplicação em Python que salva os dados em um banco de dados Postgresql. O que esse tutorial vai abordar: Vou compartilhar a aplicação em Python utilizada Criação do Dockerfile Criação do Do...
OpenTelemetry é uma estrutura (biblioteca) de observabilidade open-source que fornece um conjunto unificado de APIs, SDKs e ferramentas para coletar, processar e exportar dados de telemetria (métricas, logs e traces) de aplicações e serviços. Princip...

Deploy a Prometheus monitoring system on an Ubuntu cloud instance. The system should be secured and accessible through a reverse proxy, with proper authentication, and connected to an external Node Exporter. You can follow these steps:
Update your package list and install Prometheus with the following commands:
sudo apt update
sudo apt install prometheus prometheus-node-exporter
Verify the installation by checking the status of Prometheus services:
sudo service prometheus status
sudo service prometheus-node-exporter status
Completion Criteria
http://{YOUR-SERVER-IP}/ to Prometheus (<http://localhost:9090/>)
http://{YOUR-SERVER-IP}/metrics/ to the Node Exporter (<http://localhost:9100/>)
Basic authentication is set up, requiring credentials to access both endpoints.
Direct access to ports 9090 (Prometheus) and 9100 (Node Exporter) is blocked, and access is only allowed via NGINX.
Prometheus is scraping metrics from an external Node Exporter running the same saver
Azure Devops Account
Cloud Azure Account
Created a vm1 on Azure
Go to Azure Portal.
Sign in with your Azure account.
In the Azure Portal, search for Virtual Machines in the search bar
Click Create → Azure Virtual Machine.
Subscription: Select your Azure subscription.
Resource Group: Choose an existing one or create a new one.
Region: Select the closest or preferred Azure region.
Image: Select the OS (e.g., Ubuntu 20.04 LTS).
VM Size: Choose a size based on your workload (e.g., Standard_B2s for small workloads).
Open the NSG you just created.
Go to Inbound security rules under Settings.
Click + Add Rule to create a new rule.
First, go to this site to know what your public IP is - https://nordvpn.com/pt-br/what-is-my-ip/
Add an Inbound role with source your public IP and destination your VM, you will create two roles one for port 80 and the other for port 22.

Go to Putty Gen with your credentials, access Conversions → Import Key, and select .pem key

Select on creating your private key
Now you will open the Putty
Select the public IP of your VM and Go to SSH → Auth → Browser and select your .ppk key
Go to Azure DevOps.
Sign in with your account.
Select your organization
Click on Organization Settings (bottom left corner).
Under Pipelines, select Default.
Click + New Agent.

Select Linux and follow this installation

When you are executing the Configure Agent with ./config in one step will ask you about the token, so you will need to create this token:
Click on your Profile Icon (top-right corner).
Select Personal Access Tokens.
Click + New Token.
Put the name.
Scope: Full Access.
After you enter the token, just click enter with the default settings.
Start the Agent with ./run.sh

Create file azure-pipelines.yml
Enter these configurations:
 trigger:
 - main

 pr:
   branches:
     include:
     -  main

 stages:
     - stage: Prometheus
     displayName: Prometheus
     pool:
       name: Default
       vmImage: 'vm1'
     jobs:
     - job: Prometheus
       displayName: "Prometheus"
       steps:
       - script: |
           sudo apt install -y prometheus prometheus-node-exporter nginx apache2-utils

           sudo systemctl enable --now prometheus
           sudo systemctl enable --now prometheus-node-exporter
           sudo systemctl enable --now nginx

           systemctl status prometheus --no-pager
           systemctl status prometheus-node-exporter --no-pager
           systemctl status nginx --no-pager

         displayName: "Prometheus Install"

       - script: |
           echo 'global:
             scrape_interval: 15s

           scrape_configs:
             - job_name: "prometheus"
               static_configs:
                 - targets: ["localhost:9090"]

             - job_name: "node_exporter"
               static_configs:
                 - targets: ["localhost:9100"]
           ' | sudo tee /etc/prometheus/prometheus.yml

           sudo systemctl restart prometheus
         displayName: "Configurar Prometheus para coletar métricas"

       - script: |
           sudo ufw allow ssh
           sudo ufw allow http
           sudo ufw allow https
           sudo ufw deny 9090
           sudo ufw deny 9100
           sudo ufw enable
         displayName: "Configurar Acessos"

       - script: |
           echo 'server {
               listen 80;
               server_name _;

               location / {
                   proxy_pass http://127.0.0.1:9090/;
                   proxy_set_header Host $host;
                   proxy_set_header X-Real-IP $remote_addr;
                   proxy_set_header X-Forwarded-For $proxy_add_x_forwarded_for;
                   auth_basic "Restricted Access";
                   auth_basic_user_file /etc/nginx/.htpasswd;
               }

               location /metrics/ {
                   proxy_pass http://127.0.0.1:9100/;
                   proxy_set_header Host $host;
                   proxy_set_header X-Real-IP $remote_addr;
                   proxy_set_header X-Forwarded-For $proxy_add_x_forwarded_for;
                   auth_basic "Restricted Access";
                   auth_basic_user_file /etc/nginx/.htpasswd;
               }
           }' | sudo tee /etc/nginx/sites-available/default

           sudo systemctl restart nginx
         displayName: "Configurar Nginx"

       - script: |
           echo "Setting up Nginx authentication..."

           # Create .htpasswd file and add user
           echo "senha123" | sudo htpasswd -c -i /etc/nginx/.htpasswd joaochiroli

           sudo systemctl restart nginx
         displayName: "Configure Basic Auth for Nginx"
Test the configuration

